Posts by Tags

AmwgSampler

Simulating and Modeling Statistical Distributions via bayes.js

2 minute read

Published:

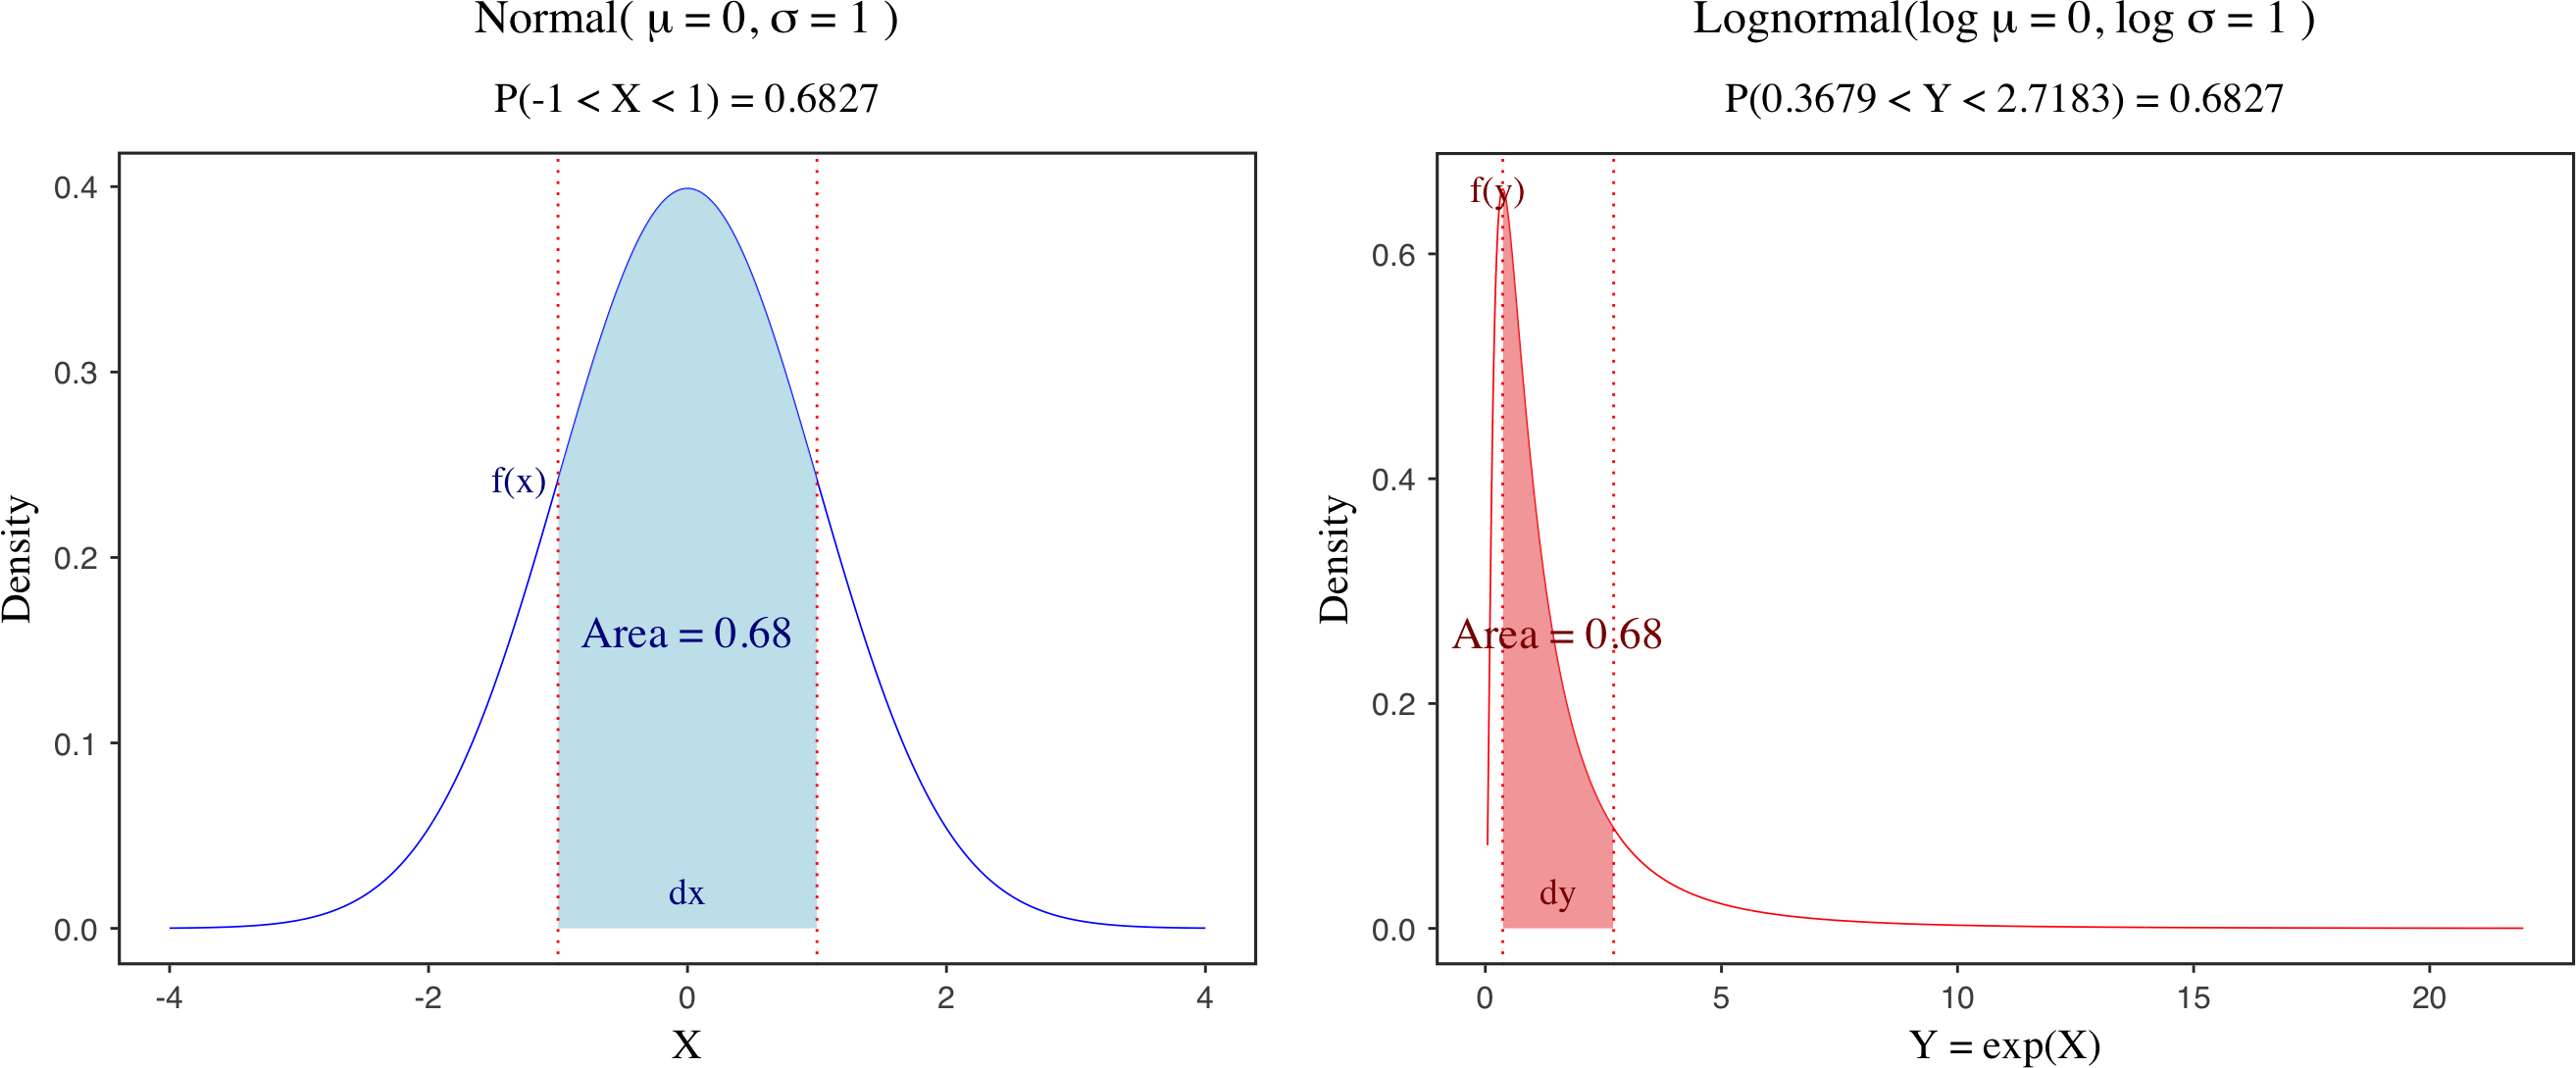
I have been thinking about building a web app for simulating data with given parameters and recovering the parameters with Bayesian MCMC samplers in JavaScript. This web app can not only make the procedures more transparent, but also help us understand the magic of the Bayesian MCMC approach. More importantly, I have benefited from this simulation-based way of thinking, so I would like to promote it in my blog.

Bayesian Linear Regression

Bayesian Linear Regression with SGD, Adam and NUTS in PyTorch

4 minute read

Published:

PyTorch has gained great popularity among industrial and scientific projects, and it provides a backend for many other packages or modules. It is also accompanied with very good documentation, tutorials, and conferences. This blog attempts to use PyTorch to fit a simple linear regression via three optimisation algorithms:

Bayesian MCMC

Simulating and Modeling Statistical Distributions via bayes.js

2 minute read

Published:

I have been thinking about building a web app for simulating data with given parameters and recovering the parameters with Bayesian MCMC samplers in JavaScript. This web app can not only make the procedures more transparent, but also help us understand the magic of the Bayesian MCMC approach. More importantly, I have benefited from this simulation-based way of thinking, so I would like to promote it in my blog.

Bayesian estimation

Multivariate Normal distribution and Cholesky decomposition in Stan

5 minute read

Published:

This post provides an example of simulating data in a Multivariate Normal distribution with given parameters, and estimating the parameters based on the simulated data via Cholesky decomposition in stan. Multivariate Normal distribution is a commonly used distribution in various regression models that generalize the Normal distribution into multidimensional space. Its PDF can be expressed as:

Bayesian linear mixed effect model

Simulation-based linear mixed effect regression models with stan

12 minute read

Published:

In this blog, I will provide a step-by-step instruction of how we can generate data from a mixed effect model and recover the parameters of the model with the simulated dataset. This simulation-based experiment can help us better understand the structure and generative process of the multilevel model with correlated random intercepts and slopes. To proceed, I will first illustrate the general form of mixed effect models, and generate data based on a given set of design matrices and parameters ($X,\beta, Z, b$). In the end, I will set a Bayesian model to estimate the parameters on the simulated data via stan.

Cholesky decomposition

LKJ correlation distribution in Stan

4 minute read

Published:

Lewandowski-Kurowicka-Joe (LKJ) distribution is a very useful prior distribution for parameter estimation in correlation matrices, and is also tightly related to matrix factorizations such as Cholesky decomposition. For example, when you use Cholesky decomposition to decompose a variance-covariance matrix ($\Sigma$​) into the multiplication of 3 matrices, you can set $\text{LKJCorr}$​ prior for the correlation matrix $\text{R}$​​.

Multivariate Normal distribution and Cholesky decomposition in Stan

5 minute read

Published:

This post provides an example of simulating data in a Multivariate Normal distribution with given parameters, and estimating the parameters based on the simulated data via Cholesky decomposition in stan. Multivariate Normal distribution is a commonly used distribution in various regression models that generalize the Normal distribution into multidimensional space. Its PDF can be expressed as:

Cholesky factor

Cholesky factors of covariance and correlation matrices in stan

4 minute read

Published:

In this blog, I would like to give a quick overview of different types of matrices and their transformations (e.g., Cholesky decomposition) in stan. These matrices include variance-covaiance matrix ($\Sigma$), correlation matrix ($R$), Cholesky factor of covariance matrix ($L$) and Cholesky factor of correlation matrix ($L_{corr}$). Before we move to Cholesky decomposition, it is good to know the relationship between variance-covaiance matrix ($\Sigma$) and correlation matrix ($R$). Simply put, we can rewrite $\Sigma$ as the product of a diagonal matrix ($\sigma$) and a correlation matrix $(R)$ in the following way. To achieve this, you can use the quad_form_diag(R, sigma) function in stan.

GPU

Checkpoints in stan via chkptstanr

4 minute read

Published:

In this blog, I will introduce a new R package chkptstanr, which allows checkpoints in stan. This feature is useful when you want to cache the model outputs by certain time steps or resume a long run at specific points due to an interruption. In general, this package can be considered as a wrapper for cmdstan, and thus you need to download and install cmdstan on your machine. Here are the step-by-step instruction on how you can deploy the environment and run the stan model via chkptstanr.

LKJ correlation distribution

LKJ correlation distribution in Stan

4 minute read

Published:

Lewandowski-Kurowicka-Joe (LKJ) distribution is a very useful prior distribution for parameter estimation in correlation matrices, and is also tightly related to matrix factorizations such as Cholesky decomposition. For example, when you use Cholesky decomposition to decompose a variance-covariance matrix ($\Sigma$​) into the multiplication of 3 matrices, you can set $\text{LKJCorr}$​ prior for the correlation matrix $\text{R}$​​.

Multivariate Normal distribution

Simulation-based linear mixed effect regression models with stan

12 minute read

Published:

In this blog, I will provide a step-by-step instruction of how we can generate data from a mixed effect model and recover the parameters of the model with the simulated dataset. This simulation-based experiment can help us better understand the structure and generative process of the multilevel model with correlated random intercepts and slopes. To proceed, I will first illustrate the general form of mixed effect models, and generate data based on a given set of design matrices and parameters ($X,\beta, Z, b$). In the end, I will set a Bayesian model to estimate the parameters on the simulated data via stan.

Multivariate Normal distribution and Cholesky decomposition in Stan

5 minute read

Published:

This post provides an example of simulating data in a Multivariate Normal distribution with given parameters, and estimating the parameters based on the simulated data via Cholesky decomposition in stan. Multivariate Normal distribution is a commonly used distribution in various regression models that generalize the Normal distribution into multidimensional space. Its PDF can be expressed as:

PyTorch

Bayesian Linear Regression with SGD, Adam and NUTS in PyTorch

4 minute read

Published:

PyTorch has gained great popularity among industrial and scientific projects, and it provides a backend for many other packages or modules. It is also accompanied with very good documentation, tutorials, and conferences. This blog attempts to use PyTorch to fit a simple linear regression via three optimisation algorithms:

R

Statistical Distributions

Simulating and Modeling Statistical Distributions via bayes.js

2 minute read

Published:

I have been thinking about building a web app for simulating data with given parameters and recovering the parameters with Bayesian MCMC samplers in JavaScript. This web app can not only make the procedures more transparent, but also help us understand the magic of the Bayesian MCMC approach. More importantly, I have benefited from this simulation-based way of thinking, so I would like to promote it in my blog.

Stochastic Gradient Descent (SGD)

Bayesian Linear Regression with SGD, Adam and NUTS in PyTorch

4 minute read

Published:

PyTorch has gained great popularity among industrial and scientific projects, and it provides a backend for many other packages or modules. It is also accompanied with very good documentation, tutorials, and conferences. This blog attempts to use PyTorch to fit a simple linear regression via three optimisation algorithms:

bayes.js

Simulating and Modeling Statistical Distributions via bayes.js

2 minute read

Published:

I have been thinking about building a web app for simulating data with given parameters and recovering the parameters with Bayesian MCMC samplers in JavaScript. This web app can not only make the procedures more transparent, but also help us understand the magic of the Bayesian MCMC approach. More importantly, I have benefited from this simulation-based way of thinking, so I would like to promote it in my blog.

chkptstanr

Checkpoints in stan via chkptstanr

4 minute read

Published:

In this blog, I will introduce a new R package chkptstanr, which allows checkpoints in stan. This feature is useful when you want to cache the model outputs by certain time steps or resume a long run at specific points due to an interruption. In general, this package can be considered as a wrapper for cmdstan, and thus you need to download and install cmdstan on your machine. Here are the step-by-step instruction on how you can deploy the environment and run the stan model via chkptstanr.

cmdstan

Checkpoints in stan via chkptstanr

4 minute read

Published:

In this blog, I will introduce a new R package chkptstanr, which allows checkpoints in stan. This feature is useful when you want to cache the model outputs by certain time steps or resume a long run at specific points due to an interruption. In general, this package can be considered as a wrapper for cmdstan, and thus you need to download and install cmdstan on your machine. Here are the step-by-step instruction on how you can deploy the environment and run the stan model via chkptstanr.

column-wise operation

Column-wise and row-wise operations in dplyr and tidyverse

3 minute read

Published:

With the development of dplyr or its umbrella package tidyverse, it becomes quite straightforward to perform operations over columns or rows in R. These column- or row-wise methods can also be directly integrated with other dplyr verbs like select, mutate, filter and summarise, making them more comparable with other functions in apply or map families. In this blog, I will briefly cover some useful manipulations over rows or columns. row- and column-wise operations

correlation matrix

Cholesky factors of covariance and correlation matrices in stan

4 minute read

Published:

In this blog, I would like to give a quick overview of different types of matrices and their transformations (e.g., Cholesky decomposition) in stan. These matrices include variance-covaiance matrix ($\Sigma$), correlation matrix ($R$), Cholesky factor of covariance matrix ($L$) and Cholesky factor of correlation matrix ($L_{corr}$). Before we move to Cholesky decomposition, it is good to know the relationship between variance-covaiance matrix ($\Sigma$) and correlation matrix ($R$). Simply put, we can rewrite $\Sigma$ as the product of a diagonal matrix ($\sigma$) and a correlation matrix $(R)$ in the following way. To achieve this, you can use the quad_form_diag(R, sigma) function in stan.

covariance-covariance matrix

Cholesky factors of covariance and correlation matrices in stan

4 minute read

Published:

In this blog, I would like to give a quick overview of different types of matrices and their transformations (e.g., Cholesky decomposition) in stan. These matrices include variance-covaiance matrix ($\Sigma$), correlation matrix ($R$), Cholesky factor of covariance matrix ($L$) and Cholesky factor of correlation matrix ($L_{corr}$). Before we move to Cholesky decomposition, it is good to know the relationship between variance-covaiance matrix ($\Sigma$) and correlation matrix ($R$). Simply put, we can rewrite $\Sigma$ as the product of a diagonal matrix ($\sigma$) and a correlation matrix $(R)$ in the following way. To achieve this, you can use the quad_form_diag(R, sigma) function in stan.

dplyr

Column-wise and row-wise operations in dplyr and tidyverse

3 minute read

Published:

With the development of dplyr or its umbrella package tidyverse, it becomes quite straightforward to perform operations over columns or rows in R. These column- or row-wise methods can also be directly integrated with other dplyr verbs like select, mutate, filter and summarise, making them more comparable with other functions in apply or map families. In this blog, I will briefly cover some useful manipulations over rows or columns. row- and column-wise operations

functional programming

logistic regression

Understanding Logistic Regression in R

5 minute read

Published:

To be honest, logistic regression (LR) can be quite confusing, since it involves too many new terms, including odds, odds ratio, log odds ratio, log-odds/logit and sigmoid function. People with various backgrounds often explain LR in different ways. In statistics, LR is defined as a regression model where odds and odds ratio are first introduced and log-odds/logit transformation is explained later. But in machine learning, LR is mostly used for classification tasks (e.g., spam vs. not spam) and they (only) highlight the sigmoid activation function plus binary cross-entropy loss. They do not even explain what is odds ratio and log odds ratio in machine learning tutorials of LR.

map

multinomial logistic regression

plotly

Simulating and Modeling Statistical Distributions via bayes.js

2 minute read

Published:

I have been thinking about building a web app for simulating data with given parameters and recovering the parameters with Bayesian MCMC samplers in JavaScript. This web app can not only make the procedures more transparent, but also help us understand the magic of the Bayesian MCMC approach. More importantly, I have benefited from this simulation-based way of thinking, so I would like to promote it in my blog.

Understanding Logistic Regression in R

5 minute read

Published:

To be honest, logistic regression (LR) can be quite confusing, since it involves too many new terms, including odds, odds ratio, log odds ratio, log-odds/logit and sigmoid function. People with various backgrounds often explain LR in different ways. In statistics, LR is defined as a regression model where odds and odds ratio are first introduced and log-odds/logit transformation is explained later. But in machine learning, LR is mostly used for classification tasks (e.g., spam vs. not spam) and they (only) highlight the sigmoid activation function plus binary cross-entropy loss. They do not even explain what is odds ratio and log odds ratio in machine learning tutorials of LR.

purrr

rowwise operation

Column-wise and row-wise operations in dplyr and tidyverse

3 minute read

Published:

With the development of dplyr or its umbrella package tidyverse, it becomes quite straightforward to perform operations over columns or rows in R. These column- or row-wise methods can also be directly integrated with other dplyr verbs like select, mutate, filter and summarise, making them more comparable with other functions in apply or map families. In this blog, I will briefly cover some useful manipulations over rows or columns. row- and column-wise operations

stan

Cholesky factors of covariance and correlation matrices in stan

4 minute read

Published:

In this blog, I would like to give a quick overview of different types of matrices and their transformations (e.g., Cholesky decomposition) in stan. These matrices include variance-covaiance matrix ($\Sigma$), correlation matrix ($R$), Cholesky factor of covariance matrix ($L$) and Cholesky factor of correlation matrix ($L_{corr}$). Before we move to Cholesky decomposition, it is good to know the relationship between variance-covaiance matrix ($\Sigma$) and correlation matrix ($R$). Simply put, we can rewrite $\Sigma$ as the product of a diagonal matrix ($\sigma$) and a correlation matrix $(R)$ in the following way. To achieve this, you can use the quad_form_diag(R, sigma) function in stan.

Understanding Logistic Regression in R

5 minute read

Published:

To be honest, logistic regression (LR) can be quite confusing, since it involves too many new terms, including odds, odds ratio, log odds ratio, log-odds/logit and sigmoid function. People with various backgrounds often explain LR in different ways. In statistics, LR is defined as a regression model where odds and odds ratio are first introduced and log-odds/logit transformation is explained later. But in machine learning, LR is mostly used for classification tasks (e.g., spam vs. not spam) and they (only) highlight the sigmoid activation function plus binary cross-entropy loss. They do not even explain what is odds ratio and log odds ratio in machine learning tutorials of LR.

Checkpoints in stan via chkptstanr

4 minute read

Published:

In this blog, I will introduce a new R package chkptstanr, which allows checkpoints in stan. This feature is useful when you want to cache the model outputs by certain time steps or resume a long run at specific points due to an interruption. In general, this package can be considered as a wrapper for cmdstan, and thus you need to download and install cmdstan on your machine. Here are the step-by-step instruction on how you can deploy the environment and run the stan model via chkptstanr.

Simulation-based linear mixed effect regression models with stan

12 minute read

Published:

In this blog, I will provide a step-by-step instruction of how we can generate data from a mixed effect model and recover the parameters of the model with the simulated dataset. This simulation-based experiment can help us better understand the structure and generative process of the multilevel model with correlated random intercepts and slopes. To proceed, I will first illustrate the general form of mixed effect models, and generate data based on a given set of design matrices and parameters ($X,\beta, Z, b$). In the end, I will set a Bayesian model to estimate the parameters on the simulated data via stan.

LKJ correlation distribution in Stan

4 minute read

Published:

Lewandowski-Kurowicka-Joe (LKJ) distribution is a very useful prior distribution for parameter estimation in correlation matrices, and is also tightly related to matrix factorizations such as Cholesky decomposition. For example, when you use Cholesky decomposition to decompose a variance-covariance matrix ($\Sigma$​) into the multiplication of 3 matrices, you can set $\text{LKJCorr}$​ prior for the correlation matrix $\text{R}$​​.

variance-covariance matrix

Simulation-based linear mixed effect regression models with stan

12 minute read

Published:

In this blog, I will provide a step-by-step instruction of how we can generate data from a mixed effect model and recover the parameters of the model with the simulated dataset. This simulation-based experiment can help us better understand the structure and generative process of the multilevel model with correlated random intercepts and slopes. To proceed, I will first illustrate the general form of mixed effect models, and generate data based on a given set of design matrices and parameters ($X,\beta, Z, b$). In the end, I will set a Bayesian model to estimate the parameters on the simulated data via stan.